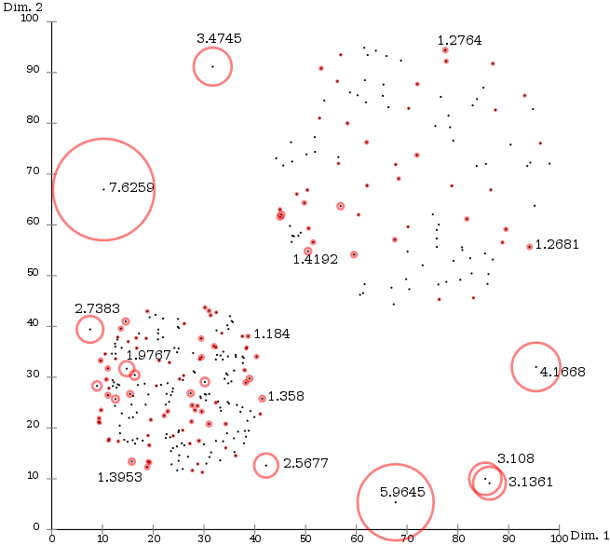
Loading... # Data Mining - Week2, Data Preprocessing ## 2.1 Data Preprocession > Why data preprocessing? Real data are notoriously **dirty**, the biggest challenge in many data minging project. ## 2.2 Data Cleaning ### 2.2.1 Missing Data *Type of Missing data*: - Missing compeletely at random - Missing conditionally at random - Not missing at rondom *Handle of Missing data*: - Ignore - FIll in the missing value manually/automaticlly ### 2.2.2 Outliers > TODO: Regression, Clustering. #### Local Outlier Factor(LOF) - $\text{distance}_k(O)$: The $k$-th closed distance to point $O$ - $d(A, B)$: The distance between $A$ and $B$. *Definition. 1*: $$ \text{distance}_k(A, B) = \max \{\text{distance}_k(B), d(A, B)\} $$ *Definition. 2*: $$ \text{lrd}(A) = 1/\left(\frac{\sum_{B\in N_k(A)} \text{distance}_k(A, B)}{|N_k(A)|}\right) $$ > $N_K(A)$: A set of $k$-nearest neighbors to point $A$ *Definition. 3*: $$ \text{LOF}_k(A) =\frac{\sum_{B \in N_k(A)} \frac{\text{lrd}(B)}{\text{lrd}(A)}}{|N_k(A)|} =\frac{\sum_{B \in N_k(A)} \text{lrd}(B)}{|N_k(A)|}/\text{lrd}(A) $$  Pic.2-1 reveals that the LOF value is larger, the point is the outlier's probability higher. > More: https://zhuanlan.zhihu.com/p/385238291 #### Duplicate Data $$ \boxed{\text{Create Keys}} \to \boxed{\text{Sort}} \to \boxed{\text{Merge}} $$ ## 2.3 Data Transformation ### 2.3.1 Attribute Types - Continous - Discrete - Ordinal - Nominal - String > 对于Nominal, 不同的编码方式会导致问题的结构上的差别 ### 2.3.2 Sampling - **Aggregation**: change of scale, more stable and less variability - **Imbalanced dataset**: Sampling can be also used to adjust the class distributions ## 2.4 Data Description ### 2.4.1 Normalization *Min-max normalization*: $$ v'=\frac{v-min}{max-min}(new_{max}-new_{min})+new_{min} $$ ### 2.4.2 Mean, Median, Mode, Variance *Mean*: $$ \tilde{x}=\frac{1}{n}\sum^n_{i=1}x_i=\frac{1}{n}(x_1+\cdots+x_n) $$ *Median*: $$ P(X \leq M)=P(X \geq M)=\int^m_{-\infty}f(x)dx=\frac{1}{2} $$ *Mode*: - The most frequently occurring value in a list *Variance*: $$ Var(X)=E[(X-\mu)^2]\\ Var(X)=\int(X-\mu)^2f(x)dx $$ ### 2.4.3 Product-moment correlation $$ r_{A,B}=\frac{\sum(A-\bar{A})(B-\bar{B})}{(n-1)\sigma_{A}\sigma_{B}}=\frac{\sum(AB)-n\bar{A}\bar{B}}{(n-1)\sigma_{A}\sigma_{B}} $$ - If $r_{A,B}>0$, $A$ and $B$ are positively correlated. - If $r_{A,B}=0$, **no linear correlation** between $A$ and $B$. - If $r_{A,B}<0$, $A$ and $B$ are negatively correlated. ### 2.4.4 Chi-squear test $$ \chi^2=\sum \frac{(\text{Observed}-\text{Expected}^2)}{\text{Expected}} $$ ## 2.5 Feature Selection ### 2.5.1 Entropy $$ H(X)=-\sum^n_{i=1}p(x_i)\log_b p(x_i-) $$ > Example: > $X: \{a=\text{"Non-Smoker"}; b=\text{"Smoker"}\}$ > $H(S|X=a)=-0.8 \cdot \log_2 0.8 -0.2 \cdot \log_2 0.2 =0.7219$ > $H(S|X=b)=0.2864$ > $H(S|X) = 0.6 \cdot 0.7219+0.4 \cdot 0.2864 =0.5477$ > $Gain(S, X)=H(S)-H(S|X)=0.4523$ -> information gain 最后修改:2021 年 10 月 09 日 © 允许规范转载 赞 0 如果觉得我的文章对你有用,请随意赞赏